A selection of dashboard projects across financial reporting, cost management, treasury, and ERP analytics. Each one replaced manual effort with a trusted, living source of truth.
Explore our dashboard portfolio across finance, operations, treasury, and ERP. Select any project to see the story behind it and preview the build.
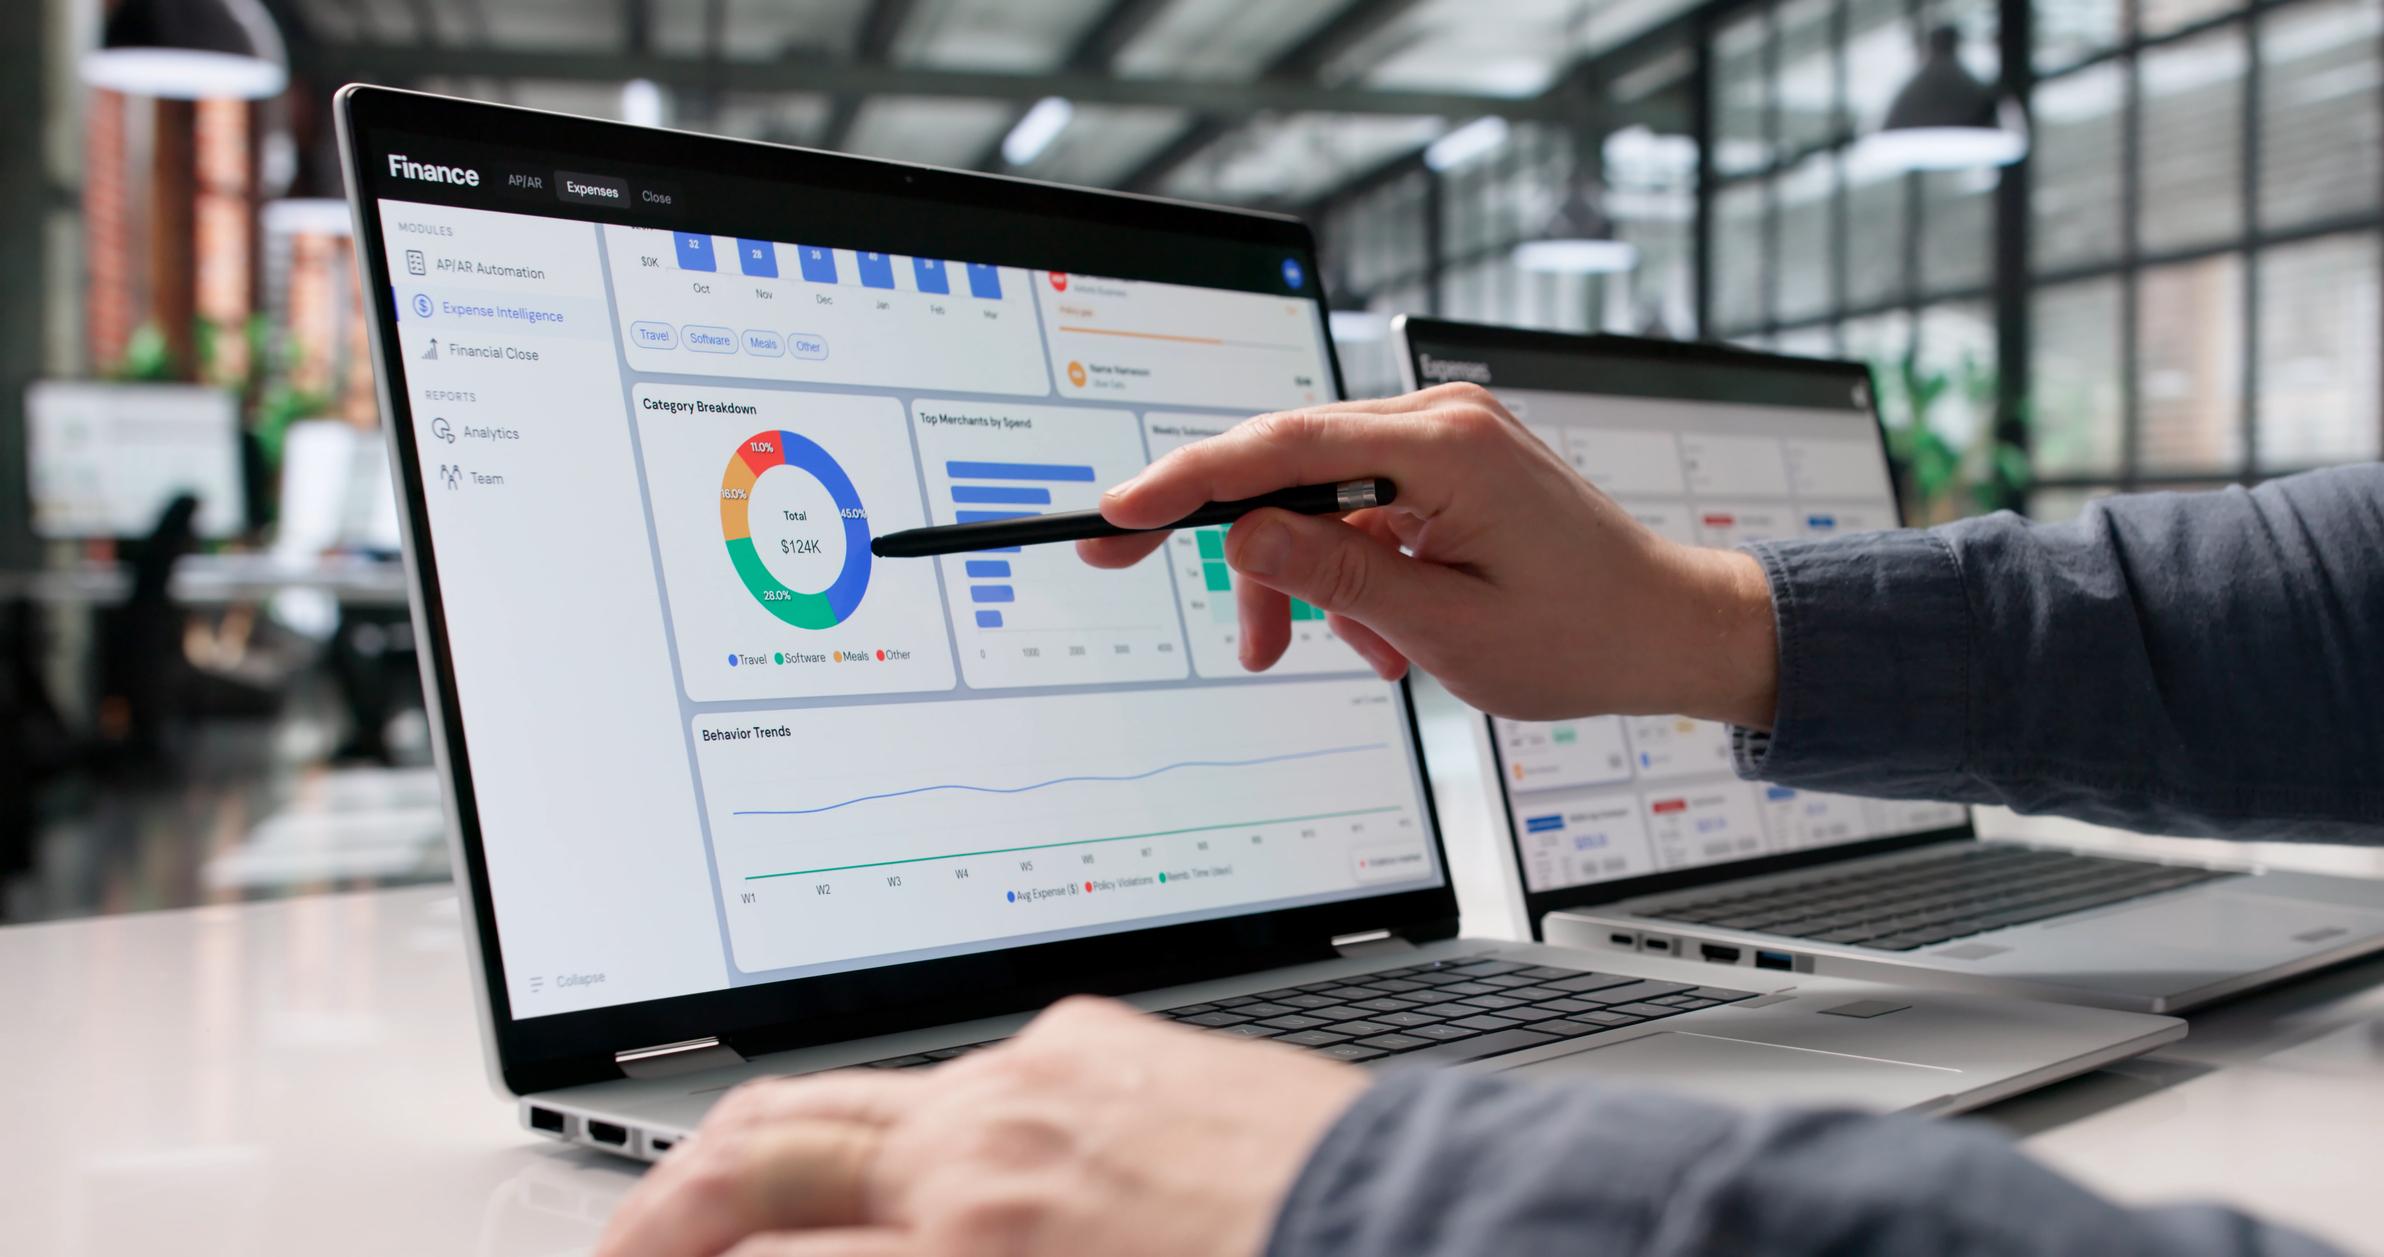
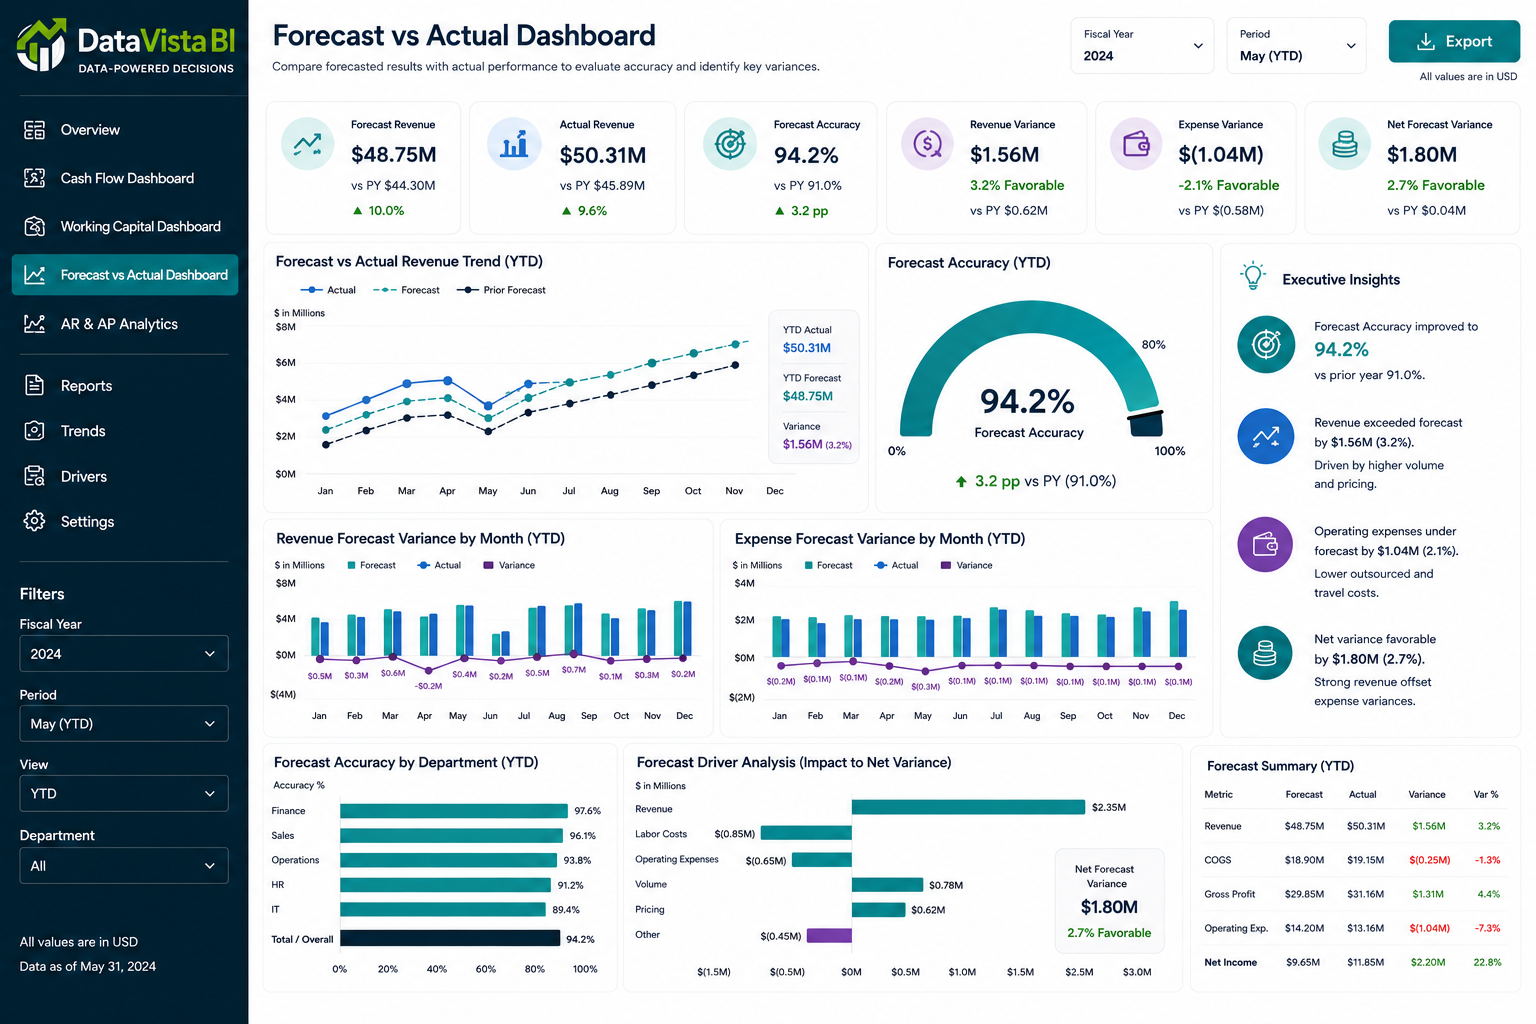


Overview, challenge, solution, and the business value delivered — with expandable dashboard previews.
A multi-entity company ran monthly leadership reviews off a 40-tab spreadsheet that took three days to assemble and was outdated by the meeting.
Numbers never tied out between finance and operations, drill-downs were impossible, and the board lacked a consistent view of margin and plan variance.
We unified GL and operational data into one governed model and built a board-ready Power BI dashboard with revenue, margin, cash, and plan-vs-actual drill-downs from company down to account.
Leadership now opens one live view in seconds, the monthly pack assembles itself, and reviews start from agreement on the numbers.
Click any preview to view it full size.
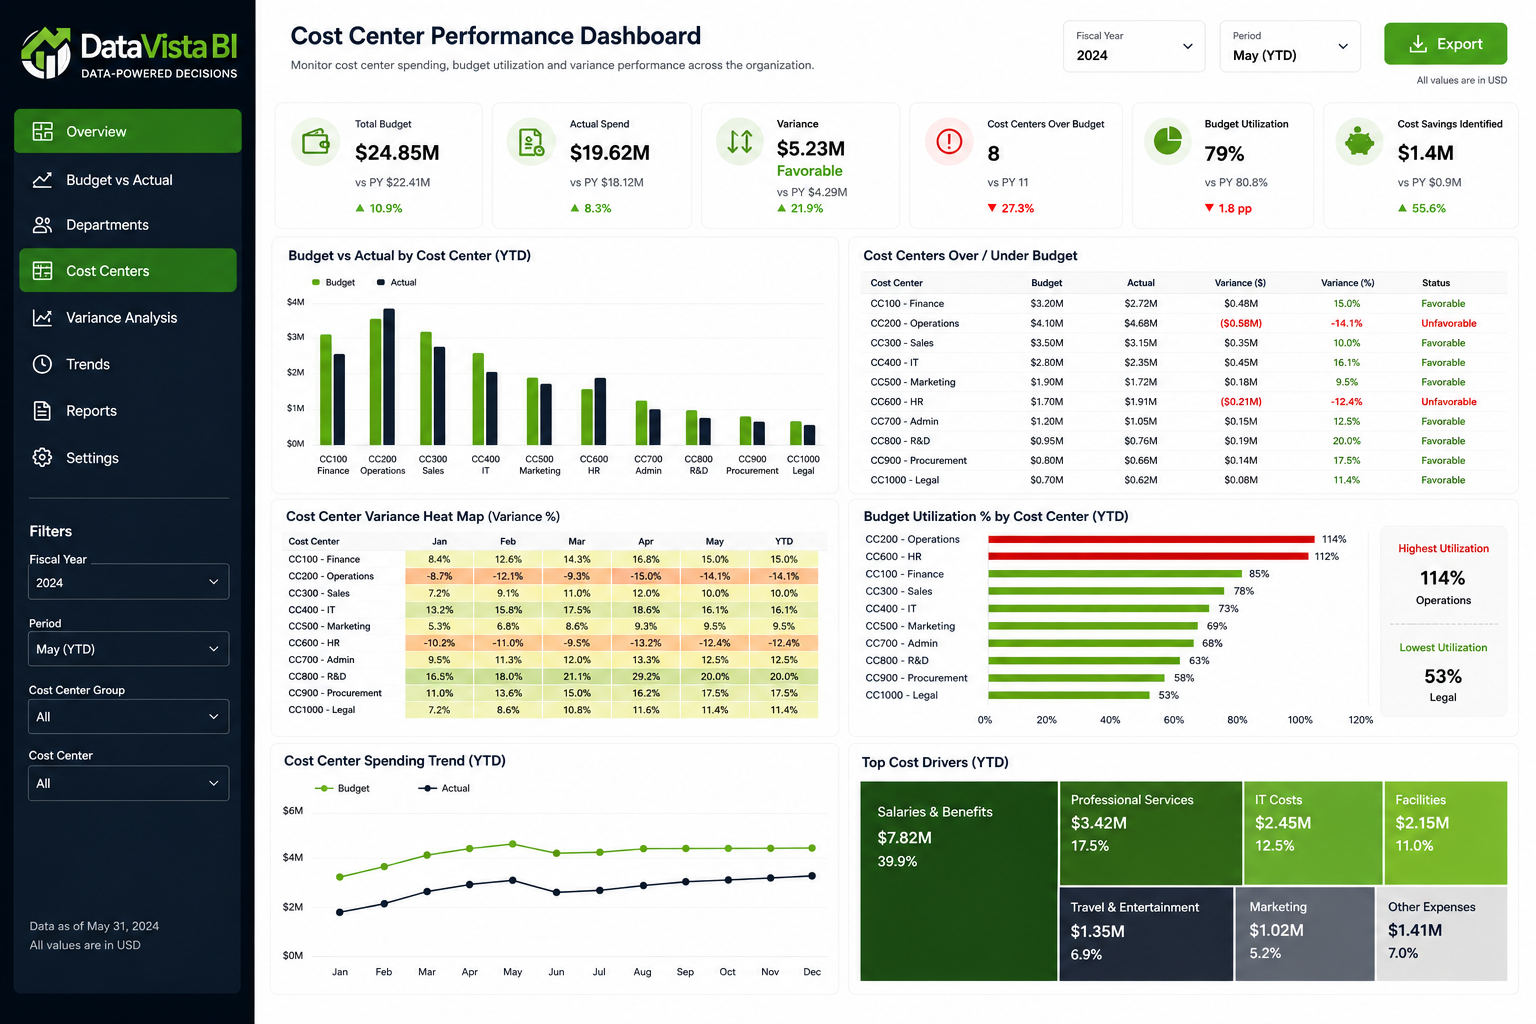
Department spend was only visible after quarter-end, so overruns were caught far too late to act on.
Cost owners had no self-service visibility, budgets lived in email, and finance fielded constant one-off questions.
We built a cost center dashboard with budget-vs-actual by department, owner, and account, plus alerting on variance thresholds and a commentary workflow.
Cost owners now manage their own budgets in real time, variance questions to finance dropped sharply, and overruns are caught while they can still be fixed.
Click any preview to view it full size.
The team forecast cash in a fragile spreadsheet, with no ability to test scenarios or see liquidity risk early.
Manual updates were error-prone, the outlook was stale within days, and leadership couldn't see runway under different assumptions.
We delivered a rolling 13-week cash flow forecast dashboard driven by AR, AP, and payroll data, with best/base/worst scenarios and liquidity alerts.
Treasury now sees liquidity weeks ahead, models scenarios in minutes, and walks into decisions with a defensible cash position.
Click any preview to view it full size.
Critical operational KPIs lived inside SAP and required specialists to extract — so most leaders never saw them.
Reporting cycles took days, data was locked behind technical exports, and there was no daily operational pulse.
We built reliable pipelines from SAP into an analytics model and a daily-refresh KPI dashboard covering operational and financial metrics with full lineage back to the source.
Operational KPIs are now self-service and refreshed daily, reporting cycles collapsed from days to minutes, and every figure traces back to SAP.
Click any preview to view it full size.
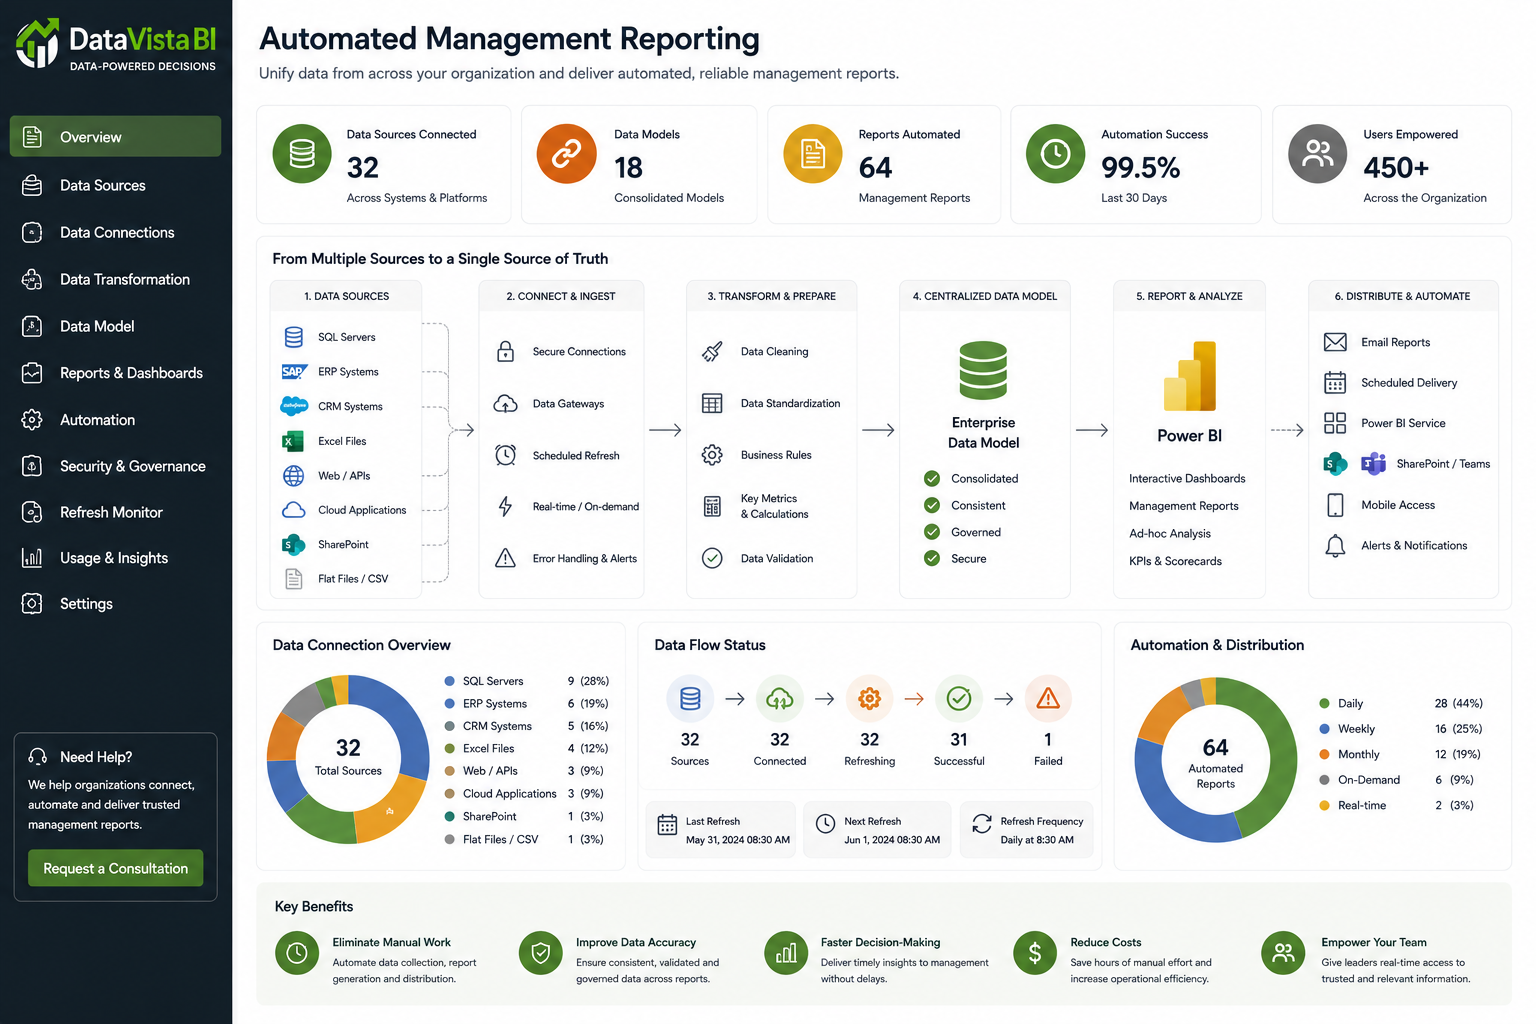
Reporting that refreshes itself — data flows in from every source and dashboards update on schedule with no manual touch.
Analysts spent days each cycle exporting, pasting, and reconciling data before anyone could look at a number.
We built automated data pipelines feeding a governed model, with validated, scheduled dashboards that refresh on their own.
Teams stopped assembling reports and started using them; numbers are always current and always tie out.
Click any preview to view it full size.
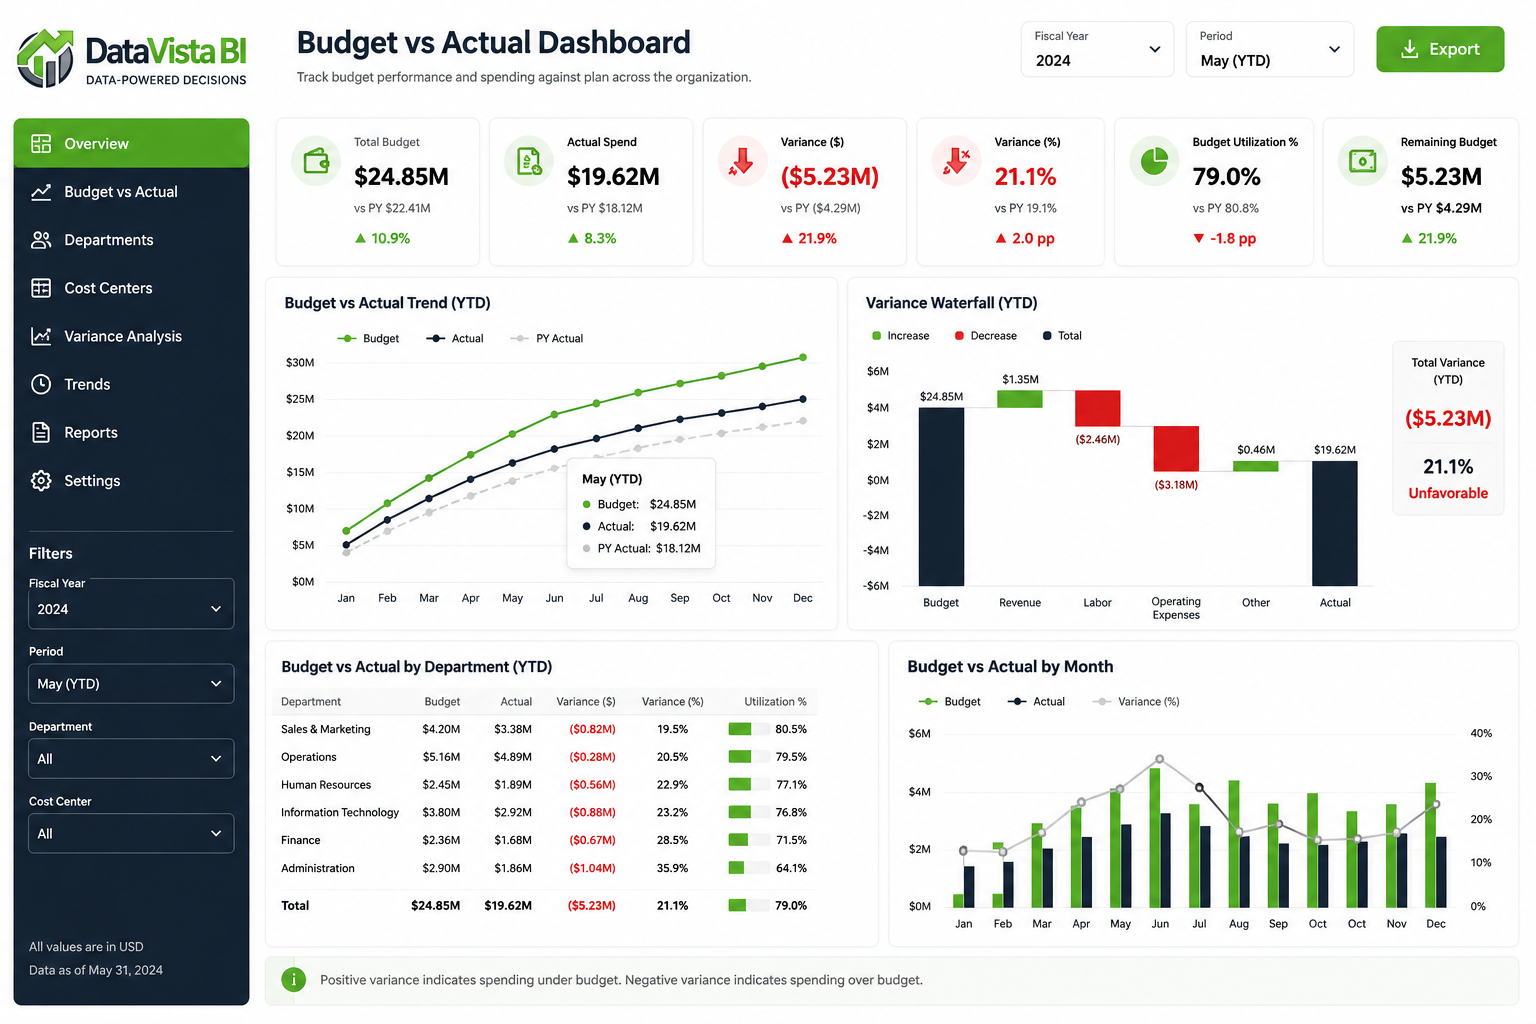
A live view of every budget line against actuals, with variance surfaced the moment the period closes.
Budget owners waited on finance for variance reports that arrived too late to change anything.
We built a budget-vs-actual dashboard with drill-down by department, account, and owner, plus threshold alerting and a commentary workflow.
Owners self-serve variance in real time, and conversations shift from ‘what happened’ to ‘what next’.
Click any preview to view it full size.
A unified BI layer that brings finance, sales, and operations into one interactive, self-service view.
Every team had its own numbers and its own spreadsheet, so leadership never saw one coherent picture.
We designed a governed BI model and role-based dashboards that let each leader explore the metrics that matter to them.
One source of truth across the business, with self-service that cut reporting requests dramatically.
Click any preview to view it full size.
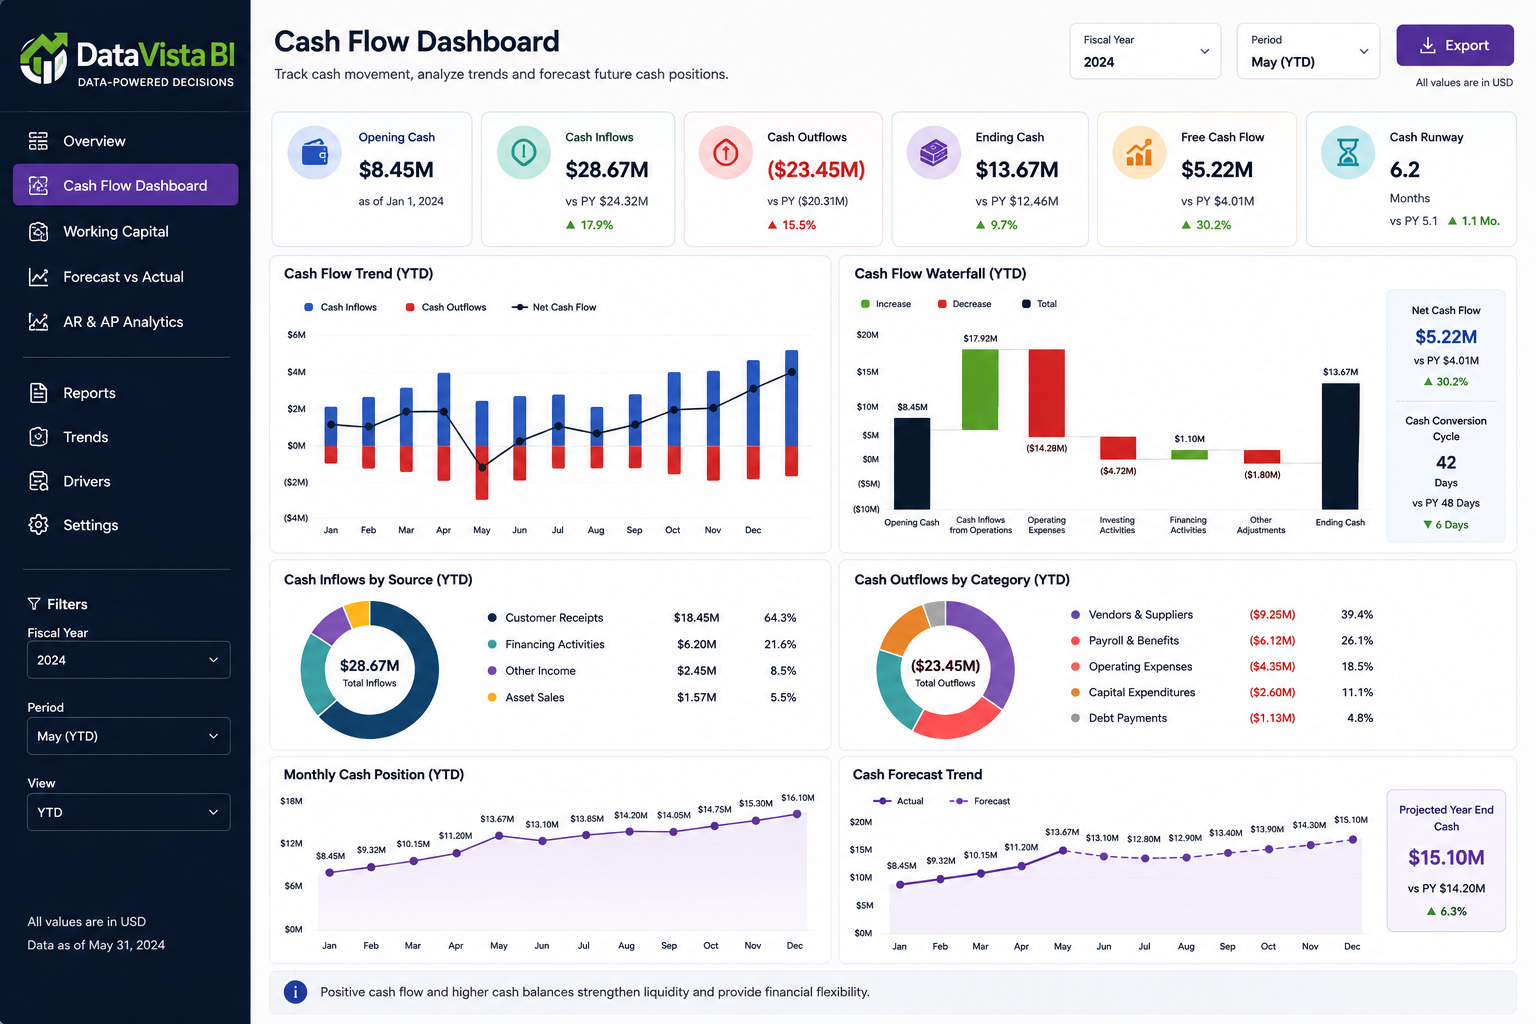
Clear visibility into money in and money out, with a forward view of liquidity and runway.
Cash position was pieced together manually and was stale by the time it reached leadership.
We built a cashflow dashboard driven by AR, AP, and bank data with inflow and outflow trends and a forward liquidity outlook.
Leadership sees liquidity clearly and early, and plans with confidence instead of guesswork.
Click any preview to view it full size.
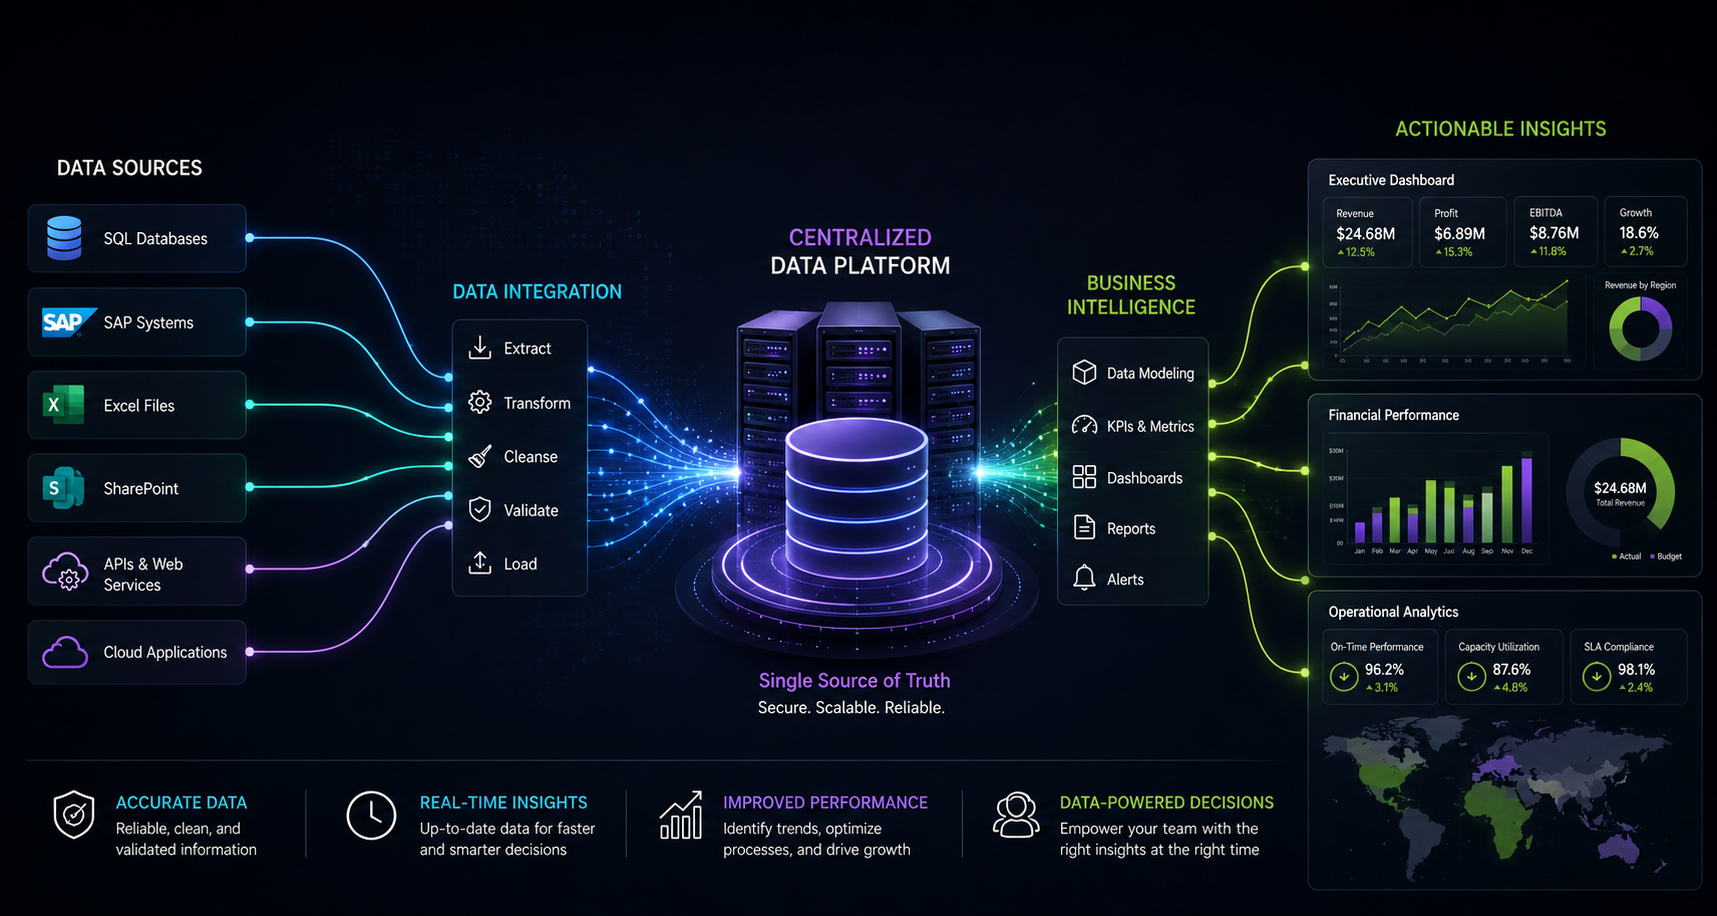
Dashboards that sit on top of fully integrated data — ERP, GL, CRM, and spreadsheets unified into one model.
Critical data lived in disconnected systems, making any cross-system view slow, manual, and unreliable.
We integrated sources into a single governed model with monitoring, so every dashboard draws from one reconciled dataset.
Cross-system reporting became instant and trustworthy, with full lineage back to each source.
Click any preview to view it full size.
A board-ready command center of the KPIs that drive strategy, designed for the C-suite.
Leadership reviews ran off static decks that were outdated the moment they were built.
We built a live executive dashboard with drill-anywhere KPIs across revenue, margin, cash, and plan variance.
Leaders open one live view, and meetings start from agreement on the numbers.
Click any preview to view it full size.
The full financial picture — P&L, balance sheet, and margin — in one interactive, always-current view.
Monthly financials were locked in static reports that couldn't be explored or drilled.
We built financial dashboards with drill-downs across statements, entities, and accounts, plus automated variance.
Finance answers the next question instantly instead of rebuilding a report to get to it.
Click any preview to view it full size.
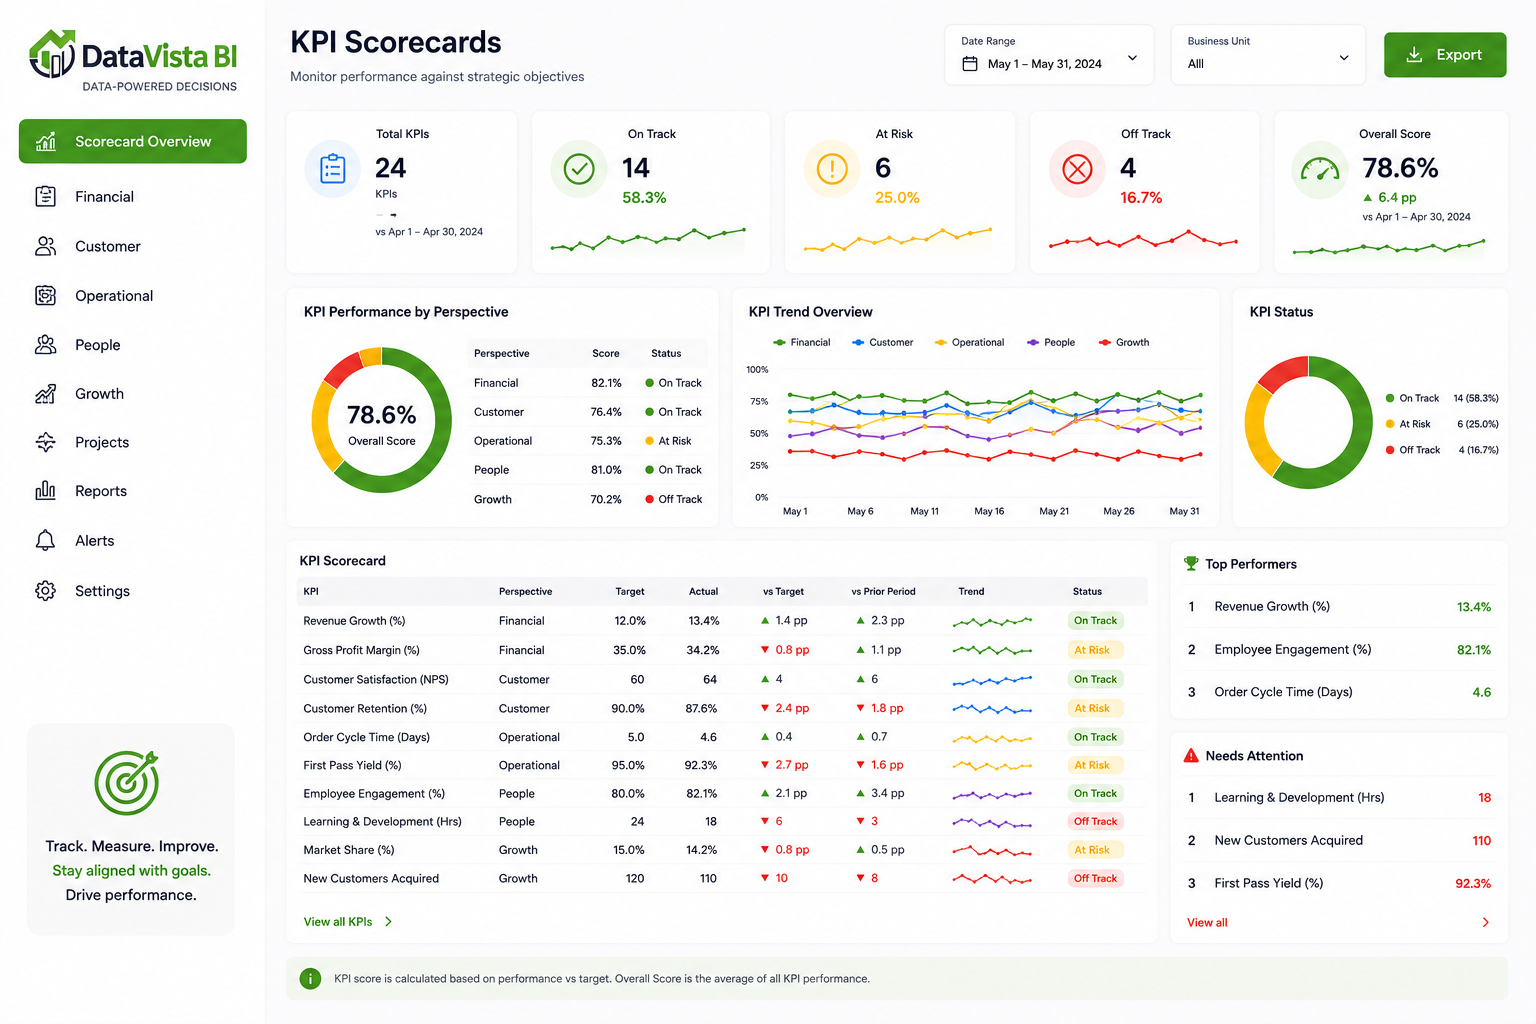
Real-time KPI monitoring that shows how the business is performing against targets, right now.
Performance was reviewed after the fact, so problems were found too late to correct.
We built performance dashboards with live KPIs, targets, and alerting so teams manage by signal.
Issues surface early, teams act in the moment, and performance against target is always visible.
Click any preview to view it full size.
Bring us your toughest reporting problem. We'll show you how it becomes a dashboard your team relies on.
Schedule a Consultation →